

USER GUIDES - GREYHOUNDS
GREYHOUND RACING USER GUIDE
The Greyhound Racing Visual Form Guide shows the same information as a traditional greyhound racing form guide together with a series of unique charts presenting this form information visually so it’s easy to read and adds real power to your analysis of a race.
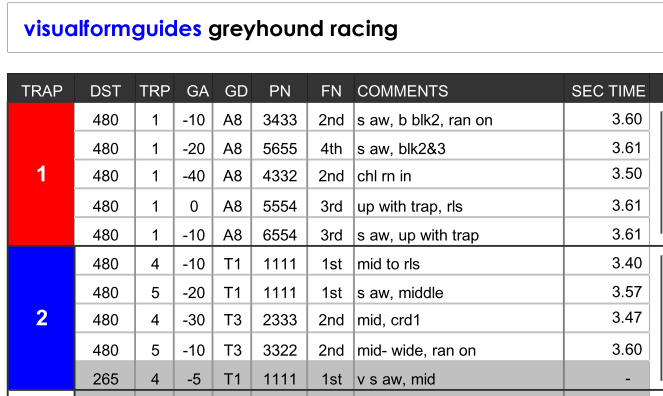
The first section of the form guide contains most of the information found in a traditional guide : race distance, trap no, going adjustment, positions during the race, finishing position and comments in running.
As with a traditional form guide it is read from bottom to top i.e. the most recent run is at the top.
Runs over different distances are greyed out and not shown in the charts as we need to compare like with like, You can still read the race information. Trap 2’s fifth last run in greyed as it was run over 265m not today’s trip of 480m.
THE CHARTS
For each chart the blocks represent the position of the dogs according to the times run during the last five races. Colours are as the colours worn by the greyhound in today’s race.
The “winning” line or the bold line within the chart shows the best performance (fastest sectional, race time etc) from the last five races of all the greyhounds. The closer to this line the blocks are the quicker the run was.
CHART 1 – SECTIONAL TIMES
The sectional time is the time it take the greyhound to reach the winning line first time round and is an indicator of how quickly the greyhound has started in the race.
The Visual Form Guide shows the last 5 runs for each greyhound so that runs can be compared for all greyhounds and trends and consistency with an individual greyhound´s performance can be evaluated.
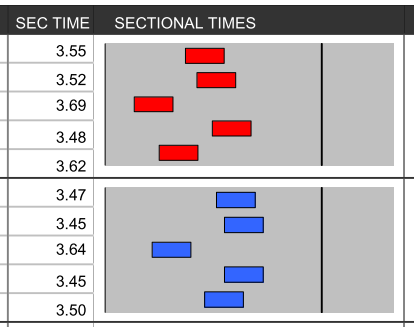
CHART 2 – POSITION AT FIRST BEND
The expected position at the first bend is key to evaluating likely trouble (crowding, bumping etc) at this point in the race. The second chart in the Visual Form Guide uses timing information of the start (sectional) and the calculated times of the race to estimate the likely positions of the greyhounds at this point.
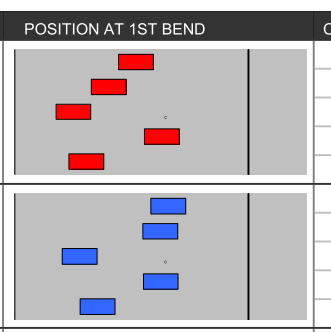
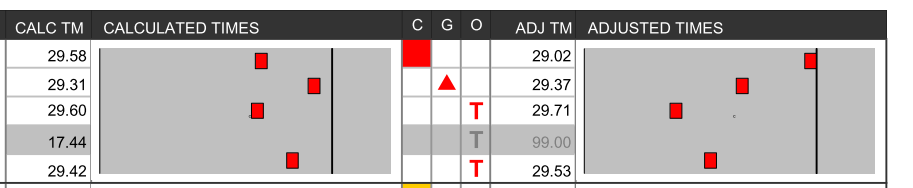
CHART 3 – CALCULATED TIME
In the same way as for sectional times (Chart 1) this chart takes the calculated times for each greyhound and represents them visually. The best performances (fastest times) show as blocks further to the right.
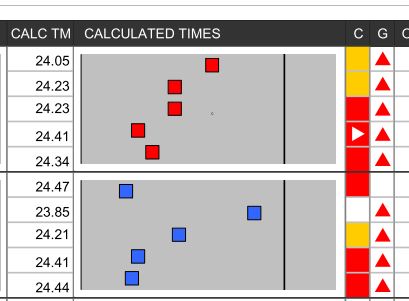
Indicator Columns
To the right of the Calculated Time charts there are three indicator columns :
The Crowing Indicator “C” indicating trouble in running that a greyhound may have encountered during the race. RED for significant trouble, AMBER for minor trouble. This feature is useful when evaluating the charts showing the times of previous runs in evaluating the usefulness or otherwise for the time of the run.
A right arrow here denotes positive comments in running such as “ran on” or “finished well”.
The Grade Indicator column “G” indicates a movement in grade.
A red upward arrow means today´s grade is higher than for that performance. A green down arrow means today´s race is a lower grade.
The “O” column shows other indicators. “H” indicates the run was a handicap. “T” indicates a trial.
CHART 4 – ADJUSTED TIMES
Chart 4 adjusts Chart 3 (Calculated Times) to take trouble in running and grade into account.
The calculated time is adjusted and chart 4 shows the adjusted times. You can see that although trap 1´s last run in the calculated time section appear to be worse that the penultimate, once we factor in significant crowding (RED Indicator) we can actually see that this dog is showing an improving trend.
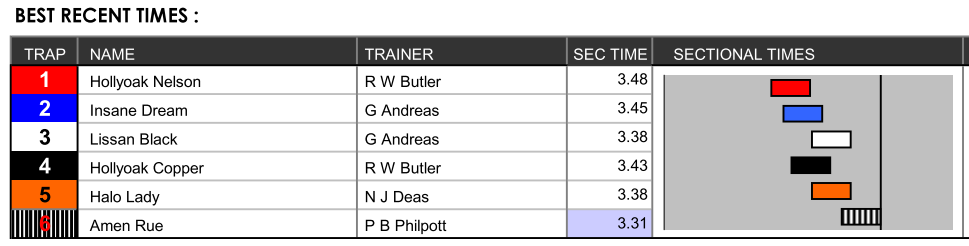
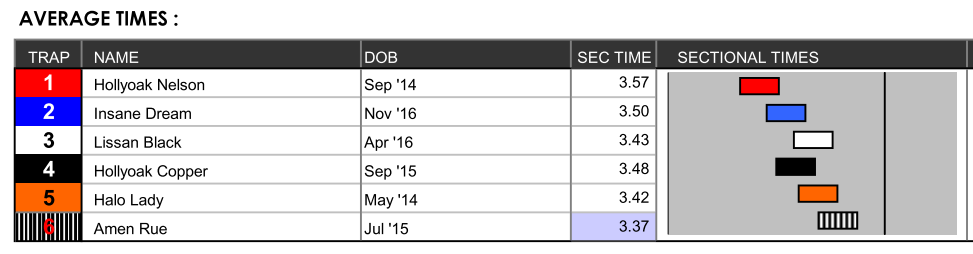
BEST RECENT + AVERAGE TIMES COMPARISON
The bottom 2 rows of the guide bring the dogs best recent and average times together into single charts so we can make comparisons easily.
This helps us see more readily things such as best performances and is especially useful when we want to consider the dogs’ likely positions at the fist bend.
The charts are the same in these two rows as described above: Sectional Time, Position at First Bend, Calculated and Adjusted times.
The trap numbers, names, trainers of the dogs and birth dates are shown in this section. Highlighted in the times columns are the best performances in each section. i.e. the best recent time and the best average time.
And that’s the end of the Greyhound Racing user guide. We’ve tried to keep it as user-friendly as possible whilst explaining everything fully but if you do have further questions please CONTACT US.
We hope you find the Visual Form Guides for Greyhounds enjoyable and profitable!
TRY VISUAL FORM GUIDES FREE!
Join us today for a free 14 day trial giving you full access to the members’ area and all horse racing, greyhound AND FOOTBALL form. give them a try and give us you comments and feedback.
Simply click the link below, then enter your name and email address to start your free trial today.