

USER GUIDES - HORSE RACING
The form for each horse is contained in a separate row. This means that performances can be compared easily. Each row contains the detailed form information and is divided into seven sections.
This section shows the horse, trainer, jockey, colours, weights, ratings etc. All the details that you would find on a traditional racecard :
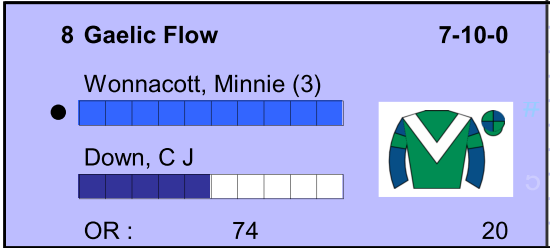
SECTION 2 – LAST TEN RACES DETAIL
Shows the details for the horses´ last ten races. Course, distance, Going etc. It is read downwards i.e. the most recent race is at the bottom.
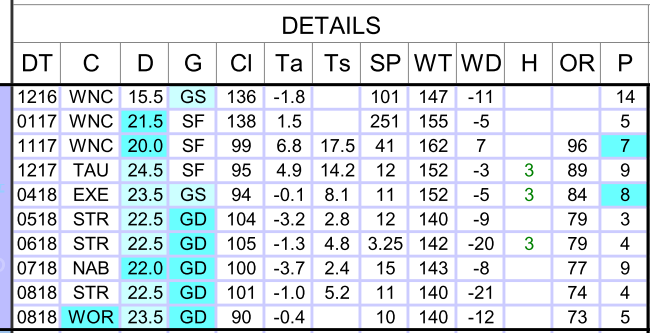
The column abbreviations are : DT – Date, C – Course, D – Distance, G – Going, Cl – Class, Ta – Time v Average Course & Distance, Ts – Time v Standard, SP – Starting Price, WT – Weight Carried, WD – Weight Difference (to winner), H – Handicap Variation, OR – Official BHB rating, P – Finishing Position.
THE GRIDS
The next sections show the form of a horse visually in a series of GRIDS. First we explain the grid concept as it applies to the rest of the sections and is a unique and powerful way of representing racing form.
Each grid has a dark line which represents the winning line. The blue blocks show finishing positions as – the number of lengths beaten in that race. So the further to the left – the worse the run. The further to the right – the better the run. If the block touches the line it won the race (or came within ½ length). A green block to the right of the winning line shows a winning run.
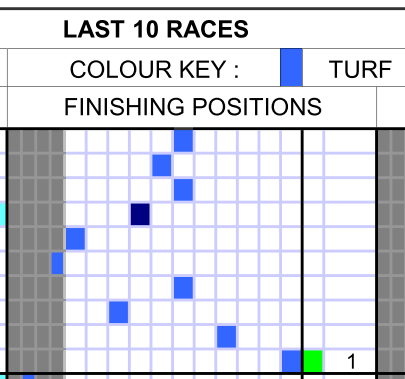
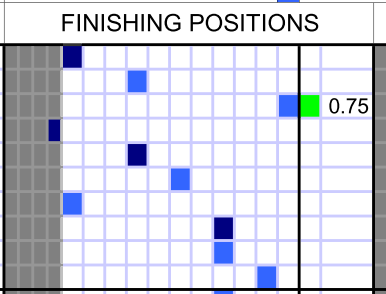
SECTION 3 – FINISHING POSITIONS
This section shows the actual finishing positions for each of the last ten races in terms of lengths behind the winner. If it won the race the number of length it won the race by will show to the right of the grid.
This horse won eight runs ago by 0.75 (3/4) length. Last time it was beaten by a length.
Which is better – being beaten a length in a Group 1 race at Ascot or being beaten half a length in a lowly claiming race at Wolverhampton? Section 4 helps us compare performances.
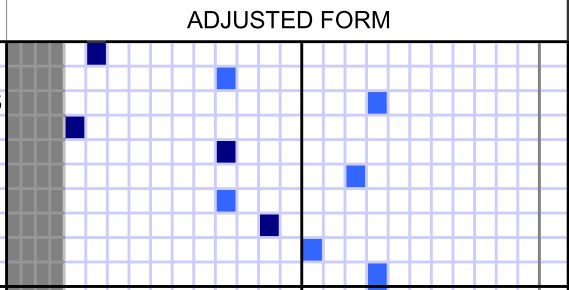
The Adjusted Form “lines up” the blocks according to the class of race and weights carried so that the runs can be compared against each other.
The blocks are shifted so we can compare the runs of individual horses and compare horses performances against each other.
Trends – The further to the right the better the run so an Adjusted Form Grid that trends to the bottom right shows improved performances. Trends toward the bottom left show worsening performances.
The Adjusted Form for the horse in the example below is showing an improved trend. The blocks trend to the bottom right.
SECTIONS 5, 6 and 7 – COLOUR CODING DIFFERENCES
The color coding is slightly different for the next three sections. Light blue blocks indicate one run and dark blue blocks indicate more than one run.
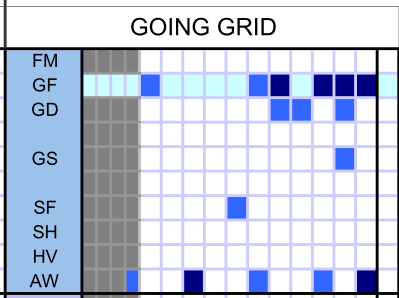
SECTION 5 – THE GOING GRID
The Going Grid again shows finishing positions in terms of lengths behind the winner but on varying ground conditions (“Going”).
Today´s going is shown by the row highlighted in light blue. It´s Good to Firm in the example below. This grid also shows a horse that has run better in the past on firmer ground. The only times it has won have been on Good to Firm (Blocks touching the black winning line) and on its one run on Soft it was beaten 6 lengths.
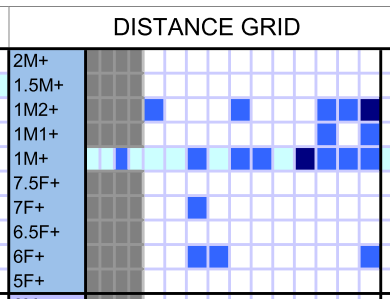
SECTION 6 – THE DISTANCE GRID
The Distance Grid shows finishing positions in terms of lengths behind the winner by distance raced.
We can be quite confident that the horse in the example below is going to stay today’s trip of a mile as it has won more than once over 1m2f+ (Dark blue blocks touching winning line at 1m2f).
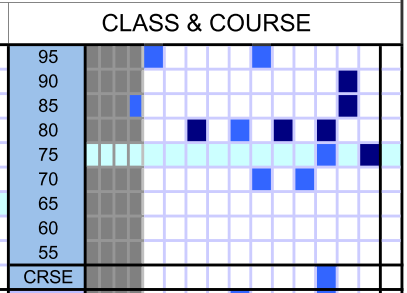
SECTION 7 – THE CLASS AND COURSE GRID
The Class and Course Grid again shows finishing positions in terms of lengths behind the winner by class of race (main grid) and at today’s track (bottom row of grid).
Looking at the example below we see a horse that has won more than once when the class of race was 75 – the same class as today’s race (dark blue blocks touching line at 75) and never won a different class race.
The Course (“CRSE”) part of the grid shows us it has raced once here before and was beaten 2 lengths.
And that’s the end of the Horse Racing user guide.
We know some of the concepts contained in the Horse Racing Visual Form Guide are a bit more tricky than the guides for greyhounds and football. That’s because there are more factors to consider: weight, jockey, trainer, going, etc. We know that if you spend a few minutes getting to know the “GRID” concept, the rest is easy, and you will have a powerful and easy-to-use analysis tool to asses any race.
We’ve tried to keep this user-guide as user-friendly as possible while at the same time explaining everything but if you do have further questions please CONTACT US.
We hope you find the Visual Form Guides for Horse Racing, fun, enjoyable and profitable!
Simply click the link below, then enter your name and email address to start your free trial today.