

USER GUIDES - FOOTBALL
The various sections contain useful information whether you’re betting on the 1X2, corners, goalscorers, bookings, total goals, half betting or bookings. The guide is divided into 9 sections.
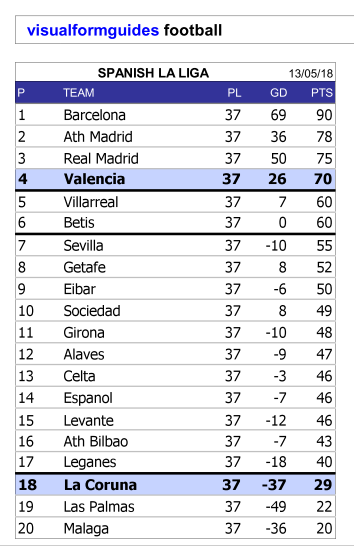
This section shows the current league table. Today’s teams’ positions are highlighted.
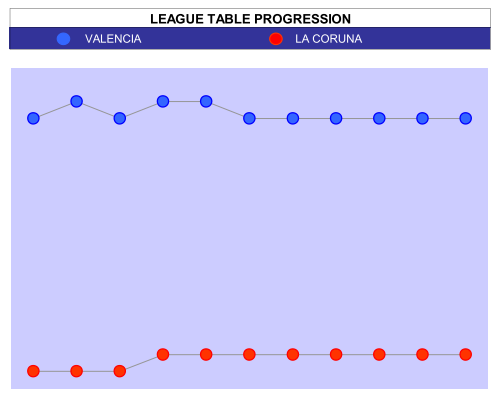
This shows the league position of each of today´s teams after each of their last 10 matches.
Home Team is shown in blue -Away Team is shown in red.
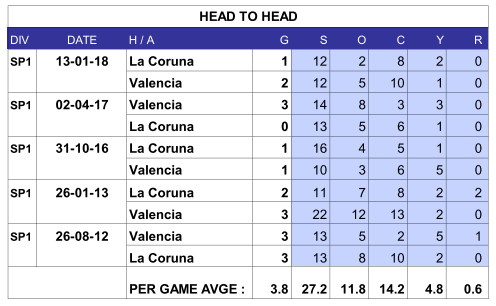
Here we can see the results when these two teams met over the last couple of seasons.
The date and result are shown along with Shots (S), On Target (O), Corners (C), Yellow Cards (Y) and Red Cards (R).
This section shows the match stats for both of the teams together. It shows the averages for each of each team´s last 5 matches (home or away).
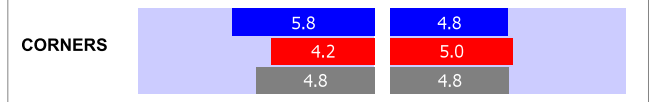
Home team stats are shown on the blue bars, Away team on the red bars. The grey bar shows the AVERAGE for ALL TEAMS in this league this season.
This section shows AGAINST as well as FOR, goals conceded, shots against etc.
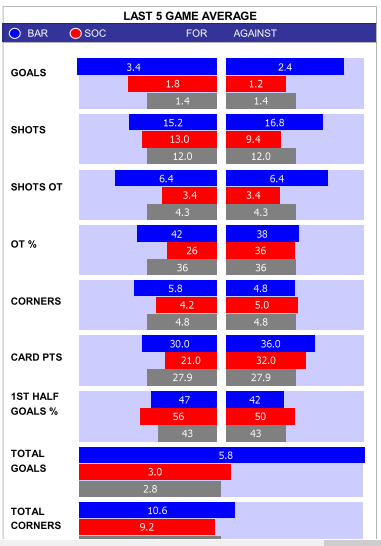
On average in this league this season teams win 4.8 corners per match. (Clearly this is the same figure as corners conceded average)
The home team here over the last 5 games won 5.8 corners a game conceding on average 4.8 a game.
The away team today over their last 5 games have won an average of 4.2 corners per game and conceded 5.0.
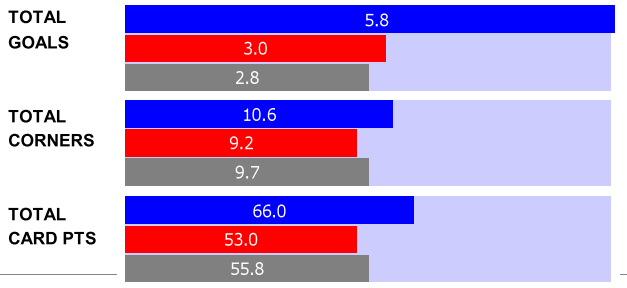
So for example here in the home team’s last five games there have been, on average 5.8 total goals, 10.6 total corners and 66 total card points a game.
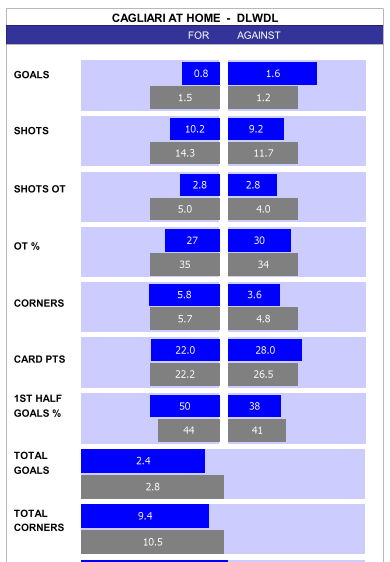
This part show the same statistics as for section 4 but shows averages for the last 5 HOME games for today’s HOME team. Cagliari, in the below example scored an average of 0.8 goals in their last 5 home games but conceded at 1.6 a game.
You may notice that in this section that the grey AVERAGE bars can be different sizes. This is because the FOR graph looks at averages for teams playing at HOME only and the AGAINST at those for teams playing AWAY.
The grey bars at the top of the chart below shows us that teams playing at home on average score more goals (1.5) and have more shots (14.3) than teams playing away (1.2 and 11.7).
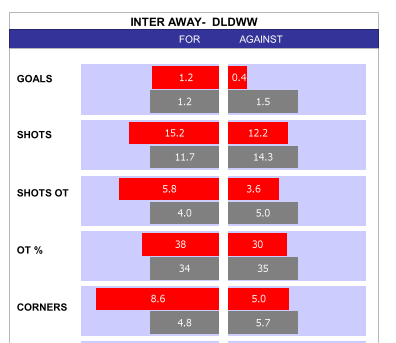
This sections shows the same info as the previous sections but for today´s AWAY team’s last five AWAY games.
Here Inter, have been dominating away games on all the key stats….
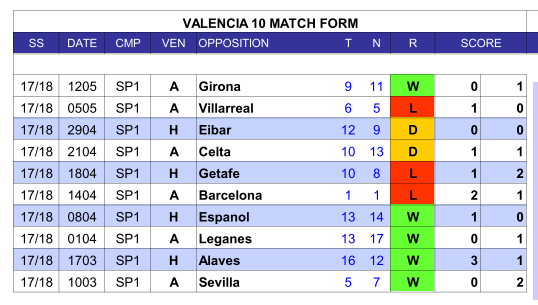
SECTION 7 – TEN MATCH FORM DETAIL
Here you can find detail for each team’s last ten matches. The most recent match is at the top.
The first figure to the right of the OPPOSITION column shows the league position of the opponents when the match was played (position then ‘N’). To the right of this shows their league position now ‘N’. So Valencia (below) played Villarreal 2 games ago when Villarreal were sixth. Now Villarreal are fifth.
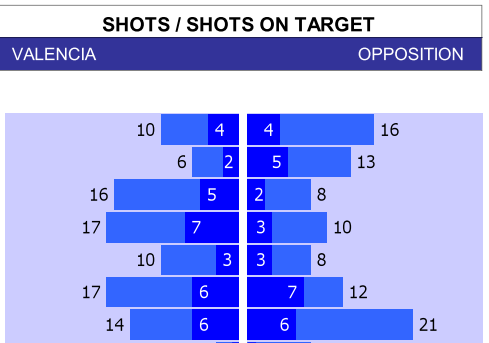
This section contains three charts showing stats for each team’s last ten games in visual form.
SHOTS
Shots for and against are shown in the first chart. The dark blue bars denote Shots on Target.
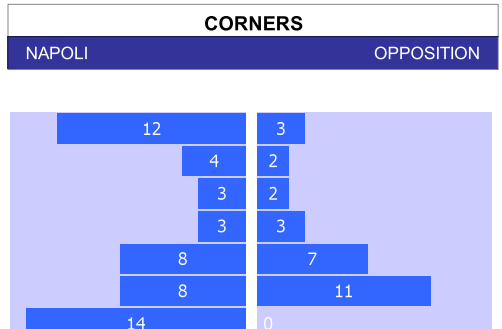
The second chart shows corners, won and conceded.
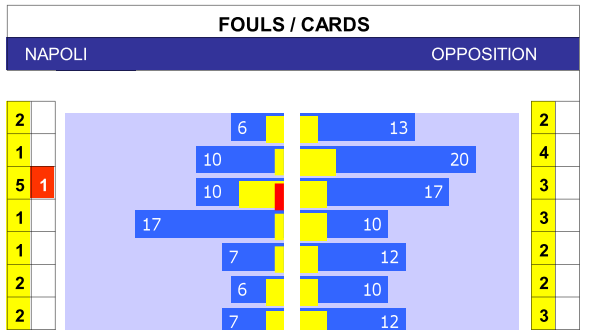
FOULS & CARDS
The third shows fouls and cards. The blue bars shows the number of fouls committed (left hand side) and those committed by the opposition (right hand side).
The number of yellow and red cards are also shown in this chart.
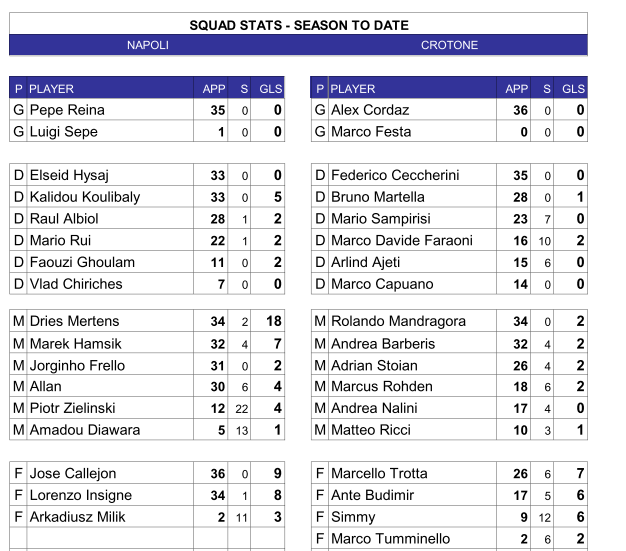
Squad stats for each team are shown here. The appearances shown are league appearances. In the S column you can also see substitute appearances. GLS denotes goals.
Players are grouped by position (G – Goalkeeper, D – Defender, M – Midfielder, F – Forward) and sorted with players with the most appearances at the top.
We hope you find the Visual Form Guides for Football enjoyable and profitable!
Simply click the link below, then enter your name and email address to start your free trial today.